Page 26 - Winds Of Change College 2018
P. 26
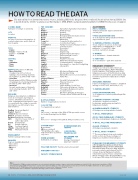
HOW TO READ THE DATA
qThe material has been drawn from various sources, including IPEDS, the Integrated Postsecondary Education Data System. IPEDS data is mostly from the 2016/17 academic year. Our thanks to DOE, IPEDS, and particularly Sam Barbett of IPEDS for his years of support.
SCHOOL NAME
Full name of college or university
CITY
Location
WEBSITE
Go here to  nd more information, to contact admissions, and to  nd out how to apply.
TYPE
• Public
• Private — Not for Pro t • Private — for Pro t •Tribal
SETTING
• City
• Suburban •Town
• Rural
DIFFICULTY: Degree of di culty • More Selective
Usually in top 20% of school rankings; most entering students: ACT (25th) > 21; SAT (V+M) > 980
• Selective
Broad range, in 35th–75th percentile of rankings; most entering students: ACT 18–21; SAT > 860–1010
• Inclusive
Accepts a wide range of students; most entering students: ACT < 18; SAT < 860
RELIGION
Religious denomination or a liation; most do not require any religious courses, attendance at services, or other commitment, but please be sure to consult with the college for speci c information; see list below for key abbreviations
TOP 3 MAJORS
Agric ................................ Agriculture, Agriculture Operations Anthro ............................. Anthropology Aviation........................... Aviation
BioMed ............................ Biomedicine BiolSci............................. Biological & Biomedical Sciences Busns .............................. Business Mgmt.
Mark ................................ Marketing
CompSci ......................... Computer & Information Sci. Const............................... Construction Trades
ConsumrSci ................... Family/Consumer/Human Science CrimJ............................... Criminal Justice Econ................................. Economics
Educ................................. Education
Eng................................... Engineering
EngTech .......................... Engineering Technologies
EnvSci ............................. Environmental Science Gov’t................................ Government Health.............................. Health Professions IntDisc............................. Multi/Interdisciplinary Studies Journ ............................... Communications, Journalism LawEnf ............................ Homeland Sec., Law Enf., Fire ghting LibArts ............................ Liberal Arts
Science
Humanities
MEng ............................... Mechanical Engineering Media............................... Media, Advertising
NatRes ............................ Natural Resources & Conservation Parks ............................... Parks/Rec.
Leisure/Fitness
PerfArt ............................ Visual & Performing Arts
PhysSci ........................... Physical Sciences
Psych ............................... Psychology
PubAdmin....................... Public Admin./Social Svcs. ReligPhil.......................... Philosophy & Religious Studies RelTheol.......................... Theology & Religious Vocations SocSci ............................. Social Sciences Technc............................. Mechanic & Repair Technicians Transp ............................. Transportation & Materials Moving
# APPLICATIONS
Number of applications received
% ACCEPTED
% of applicants accepted
SAT
SAT scores — average of the 25th & 75th percentile scores for Verbal (Reading) and for Math
ACT
ACT score — average of the 25th & 75th percentile scores
ALL STUDENTS
# BAC. DEGREES
Total baccalaureate degrees awarded in current year
6-YEAR GRADUATION RATE
% of all students who graduated with bac. degree within six years
% EARNING STEM BAC. DEGREE
% bac. degrees in science, technology, engineering, or mathematics — to all graduates — from IPEDS data;
see Note 1 at bottom of page
% WOMEN
% of enrollment — female students
% PART-TIME
% of enrollment — part-time students
INDIGENOUS STUDENTS**
“Indigenous” below includes American Indians, Alaska Natives, Native Hawaiians, Paci c Islanders, First Nations, and other Indigenous peoples of North America; data derived from several  les and the latest data from the Department of Education’s IPEDS database
# DEGREES AWARDED
Degrees to Indigenous students — weighted average of 2016, 2015, and 2014 (3, 2, 1)
% EARNING DEGREE
6-YEAR GRADUATION RATE
% of Indigenous students graduating within six years
% EARNING STEM BAC. DEGREE
% bachelor’s degrees in science, technology, engineering, and math to Indigenous students
# UNDERGRADUATE STUDENTS
All Indigenous undergraduate students
% OF ALL UNDERGRADS
# FULL-TIME UNDERGRAD. STUDENTS
Full-time undergraduate Indigenous students
% OF ALL FULL-TIME UNDERGRADS # GRAD. STUDENTS
All Indigenous graduate students
% OF ALL GRAD. STUDENTS
** The percentages below each number in this section are the percentages of Indigenous students in that category.
PROGRAMS FOR INDIGENOUS STUDENTS
» Not all support programs are listed. Check with individual colleges for more information. Information taken from prior data, websites, personal contacts, and returned Top 200 surveys. A special thank-you to all who returned the surveys. Please contact the Winds of Change editor at kenglish@aises.org for a copy of the survey for the next issue.
AmBap Baptst ChChrst DChrst EvChrst LDS
Presb RC SBap UMeth Wsly
American Baptist Baptist
Church of Christ Disciples of Christ Evangelical Christian Church of Jesus Christ of Latter-day Saints Presbyterian
Roman Catholic Southern Baptist United Methodist Wesleyan Church
TUITION/FEES*
R (resident),
NR (non-resident)
*If R & NR are the same, that information is printed only once.
ROOM & BOARD
Estimated, on campus
# DORM ROOMS ON CAMPUS
% RECEIVING FINANCIAL AID
AVG. AWARD PER STUDENT
Average  nancial aid award per student
ENROLLMENT
Full time and part time (total)
DEGREES
Degrees available/awarded: • Associate’s
• Bachelor’s
• Master’s
• PhD
FULL-TIME FACULTY Full-time instructional sta  INDIGENOUS FACULTY
FACULTY-STUDENT RATIO
Notes
1. To estimate the STEM baccalaureate degrees, we selected and totaled the number of degrees both total and Indigenous in the 422 CIP codes that are identi ed as STEM (Homeland Security-STEM-CIP web). This is current (2016) data from IPEDS; no other analysis had been done since 2008. The % STEM is shown here for all baccalaureate graduates; the % STEM Indigenous baccalaureate degrees is shown in the “Indigenous students” section.
2. If information was not available or applicable (all listings), that section was left blank.
24 WINDS OF CHANGE • 2018–2019 SPECIAL COLLEGE ISSUE aises.org